|
||||||||||||||||||
|
This is a small tutorial which shows you how to debug your application with Eclipse using J-Link, J-LInk EDU or a SAM-ICE for the JTAG interface. It is highly recommended that you installed the YAGARTO Tools and read
part 2 and part 3
of the
For a complete C/C++ development system we need the following components:
1. J-Link "Software and documention pack": The J-Link / SAM-ICE is developed by SEGGER, therefore you can download the latest software from the SEGGER J-Link ARM software page. Download the "Software and documentation pack", expand the zip file, and start the setup program. For more information about how to install and setup the J-Link itself, take a look in the J-Link manual (pdf, 3 MB), which can be found at the following SEGGER page. If you already installed the YAGARTO Tools, GNU ARM toolchain and IDE, you can go to the next section.
If you do not have the utilities like make, sh, rm, cp and mkdir, I recomended to use these tools from the latest YAGARTO Tools (20121018) installer, which can be found here. Start the installer, at the "Choose Components" page you can accept the defaults:
Press the "Next >" button and follow the instruction of the installer.
If you did not already install the toolchain, you can download the installer from the front page. Start the installer, at the "Choose Components" page you can accept the defaults:
Press the "Next >" button and follow the instruction of the installer.
More information about the Integrated Development Enviroment and how to install can be found in this tutorial here. For the STM32F407 project the following hardware was used:
This is an Olimex STM32-E407 development board, which is equipped with a STM32F407ZG cpu. Here I will show you, how to compile your first program. These examples was tested with J-Link ARM v4.58a and can be used to debug in RAM and ROM. Download the example you need and expand the zip file
to your working directory. I will show you the next steps with the STM32F407Test example, and expanded it in the following directory: C:\temp\STM32F407Test This directory is only an example, choose what is the best for you. For the next steps I will use this directory. Open a command prompt and change in the C:\temp\STM32F407Test directory. First you must clean the project, therefore type: C:\temp\STM32F407Test>make clean The result should look like:
rm -f ./cmsis/device/startup_stm32f4xx.o ./cmsis/device/system_stm32f4xx.o ./src All list and object files are deleted, now we want to compile the program, type: C:\temp\STM32F407Test>make all The output should look like:
arm-none-eabi-gcc -x assembler-with-cpp -c -mthumb -mcpu=cortex-m4 -mfloat-abi=h A file test_ram.elf should now be created in your build directory. If you could find it, congratulations! You have compiled your first ARM program with the new toolchain. Now we want to start the J-Link GDB Server. The GNU Project Debugger (GDB) is a freely available debugger, distributed under the terms
of the GPL. It connects to an emulator via a TCP/IP connection. It can connect to every emulator
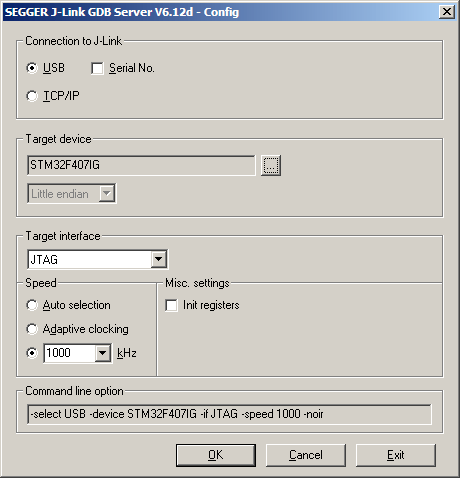
for which a GDB Server software is available. For debuging with Eclipse we will use the GDB, therefore we need a GDB Server too. At this point you must install the J-Link "Software and documention pack". Connect the J-Link to the PC and to the target (do not forget to power the target) and start the J-Link GDB Server. You will find the J-Link GDB Server in the "SEGGER \ J-Link ARM" program goup.
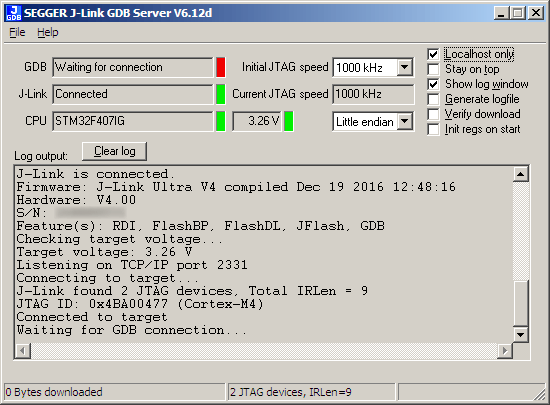
Here you can select some options, e.g. the "Target interface". Make your selections, and press "OK". The next window will look like:
Remove the checkmark of the "Stay on top" option. Then set the checkmark at "Show log window", "Cache reads" and "Init regs on start". The "Show log window" options can help us if we will get in trouble with Eclipse. Lets try to debug with Eclipse. The J-Link GDB Server must be running and be connected to the J-Link and the target, before you start the debug sesion. It is best to start the GDB Server before you start Eclipse. Here I use the fast way, and do not demonstrate step by step. The detailed tutorial how to use Eclipse and how to setup a project can be found in part3. If you are not very familiar with Eclipse, take a look at part3 too. Download the STM32F407Test project and expand the zip file to your temp directory. C:\temp\STM32F407Test For the next steps I will refer to it. Now you can start Eclipse. To create an Eclipse project use "File / New / Standard Make C Project". For the project name use "STM32F407Test". Now use "Project / Properties" select "C/C++ Build" and change the "Compiler invocation command", on the "Discovery Options" tab, to your compiler executable arm-none-eabi-gcc. Press "OK" to finish this dialog. Your project is empty, and you must import the project files to Eclipse. Browse to your temp directory C:\temp\STM32F407Test and select all files with the checkmark, press "Finish" to close the dialog. For more information on how to create a project, take a look at part3. You can build your project with "Project / Build Project" now, the result of the build process will be displayed in the "Console" window. A file "test_ram.elf" should be created. Change to the "Debug Perspective" and configure the debugger.
(Click inside the picture to expand) Select the "Debugger" tab and use arm-none-eabi-gdb for the "GDB debugger". For the debugger "Commands" copy and paste the content of the stm32_ram_jlink_1.gdb text file into the window. The stm32_ram_jlink_1.gdb file is part of the example (.\prj\stm32_ram_jlink_1.gdb). For more information on how to configure the debugger, take a look at part3. The debugger is configured, and the GDB Server is hopefully running. You may start your debug session now, which could look like:
(Click inside the picture to expand) In case Eclipse refuse to download the code to the target (seems like something is blocked), take the following steps:
Now debugging should be possible again. If you need support, take a look here: |
|||||||||||||||||